> ## Documentation Index
> Fetch the complete documentation index at: https://docs.creator.fun/llms.txt
> Use this file to discover all available pages before exploring further.
# Finance stats
> Understand the stats panel on the token details page — your personal P&L, price changes, and market volume.
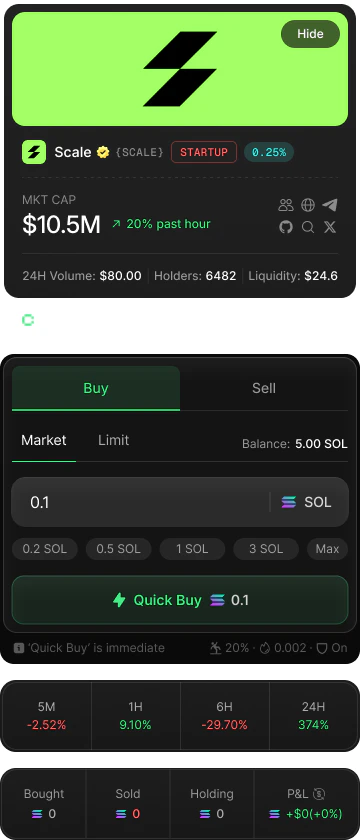
The **Finance Stats** section sits below the trade panel in the right sidebar on every token's details page. It gives you a live snapshot of your personal performance on that token alongside broader market activity. Stats refresh every 10 seconds and also update in real time whenever a new trade is detected.
 ***
## Stats overview
The section is divided into three grids, each showing a different layer of information.
The first grid shows your activity on this specific token. All values are denominated in SOL.
| Stat | What it shows |
| ----------- | ----------------------------------------------------------------------------------- |
| **Bought** | The total amount of SOL you have spent buying this token across all your purchases. |
| **Sold** | The total SOL proceeds you have received from selling this token. |
| **Holding** | The current market value of your remaining token balance, converted to SOL. |
| **P\&L** | Your overall profit or loss on this token (see below for the full calculation). |
### How P\&L is calculated
P\&L (profit and loss) answers the question: *overall, have I made or lost money on this token?*
The formula is:
```text theme={null}
P&L = Holding value + Sold proceeds − Amount invested (Bought)
```
If your P\&L is positive it is shown in green with a `+` prefix. If it is negative it is shown in red. The percentage change relative to your total investment is shown alongside the absolute SOL value.
**Example:** You bought 2 SOL worth of tokens. You later sold half for 1.5 SOL. Your remaining holdings are currently worth 1.2 SOL.
```text theme={null}
P&L = 1.2 + 1.5 − 2.0 = +0.7 SOL
```
P\&L resets to zero if you sell your entire token balance, because your **Holding** value becomes 0 and the calculation starts fresh. If you rebuy the same token, P\&L begins accumulating again from that point.
The second grid shows how the token's price has moved over four time windows. Each value is a percentage change relative to the price at the start of that window.
| Label | Period |
| ------- | ------------------------------------ |
| **5M** | Price change over the last 5 minutes |
| **1H** | Price change over the last hour |
| **6H** | Price change over the last 6 hours |
| **24H** | Price change over the last 24 hours |
Values are color-coded:
* **Green** — the price is up over that period.
* **Red** — the price is down over that period.
* **Neutral (dim white)** — no change (0%).
Use these intervals together to get a sense of momentum. For example, a token that is up 40% over 24H but down 5% over 1H may be cooling off after an earlier run.
The third grid shows market activity for the last hour. All volume figures are in SOL.
| Stat | What it shows |
| ----------- | ---------------------------------------------------------------------------------------------------------------------- |
| **1h Vol** | The total trading volume (buys + sells combined) over the last hour. |
| **Buys** | The number of buy transactions / total SOL volume from buys over the last hour. |
| **Sells** | The number of sell transactions / total SOL volume from sells over the last hour. |
| **Net Vol** | Buy volume minus sell volume. Positive (green) means more buying pressure; negative (red) means more selling pressure. |
### Buy/sell ratio bar
Below the volume numbers, a horizontal bar shows the ratio of buy volume to sell volume visually. The green portion on the left represents the share of volume from buys; the red portion on the right represents sells. A bar that is mostly green indicates strong buying interest in the last hour.
***
## Refreshing stats
Stats auto-refresh every 10 seconds and also update in real time via a live connection whenever a new order is recorded for that token. You do not need to reload the page to see the latest data. A small loading indicator appears in the top-right corner of the stats section while a refresh is in progress.
***
## Stats overview
The section is divided into three grids, each showing a different layer of information.
The first grid shows your activity on this specific token. All values are denominated in SOL.
| Stat | What it shows |
| ----------- | ----------------------------------------------------------------------------------- |
| **Bought** | The total amount of SOL you have spent buying this token across all your purchases. |
| **Sold** | The total SOL proceeds you have received from selling this token. |
| **Holding** | The current market value of your remaining token balance, converted to SOL. |
| **P\&L** | Your overall profit or loss on this token (see below for the full calculation). |
### How P\&L is calculated
P\&L (profit and loss) answers the question: *overall, have I made or lost money on this token?*
The formula is:
```text theme={null}
P&L = Holding value + Sold proceeds − Amount invested (Bought)
```
If your P\&L is positive it is shown in green with a `+` prefix. If it is negative it is shown in red. The percentage change relative to your total investment is shown alongside the absolute SOL value.
**Example:** You bought 2 SOL worth of tokens. You later sold half for 1.5 SOL. Your remaining holdings are currently worth 1.2 SOL.
```text theme={null}
P&L = 1.2 + 1.5 − 2.0 = +0.7 SOL
```
P\&L resets to zero if you sell your entire token balance, because your **Holding** value becomes 0 and the calculation starts fresh. If you rebuy the same token, P\&L begins accumulating again from that point.
The second grid shows how the token's price has moved over four time windows. Each value is a percentage change relative to the price at the start of that window.
| Label | Period |
| ------- | ------------------------------------ |
| **5M** | Price change over the last 5 minutes |
| **1H** | Price change over the last hour |
| **6H** | Price change over the last 6 hours |
| **24H** | Price change over the last 24 hours |
Values are color-coded:
* **Green** — the price is up over that period.
* **Red** — the price is down over that period.
* **Neutral (dim white)** — no change (0%).
Use these intervals together to get a sense of momentum. For example, a token that is up 40% over 24H but down 5% over 1H may be cooling off after an earlier run.
The third grid shows market activity for the last hour. All volume figures are in SOL.
| Stat | What it shows |
| ----------- | ---------------------------------------------------------------------------------------------------------------------- |
| **1h Vol** | The total trading volume (buys + sells combined) over the last hour. |
| **Buys** | The number of buy transactions / total SOL volume from buys over the last hour. |
| **Sells** | The number of sell transactions / total SOL volume from sells over the last hour. |
| **Net Vol** | Buy volume minus sell volume. Positive (green) means more buying pressure; negative (red) means more selling pressure. |
### Buy/sell ratio bar
Below the volume numbers, a horizontal bar shows the ratio of buy volume to sell volume visually. The green portion on the left represents the share of volume from buys; the red portion on the right represents sells. A bar that is mostly green indicates strong buying interest in the last hour.
***
## Refreshing stats
Stats auto-refresh every 10 seconds and also update in real time via a live connection whenever a new order is recorded for that token. You do not need to reload the page to see the latest data. A small loading indicator appears in the top-right corner of the stats section while a refresh is in progress.