
Stats overview
The section is divided into three grids, each showing a different layer of information.Your personal stats — Bought, Sold, Holding, and P&L
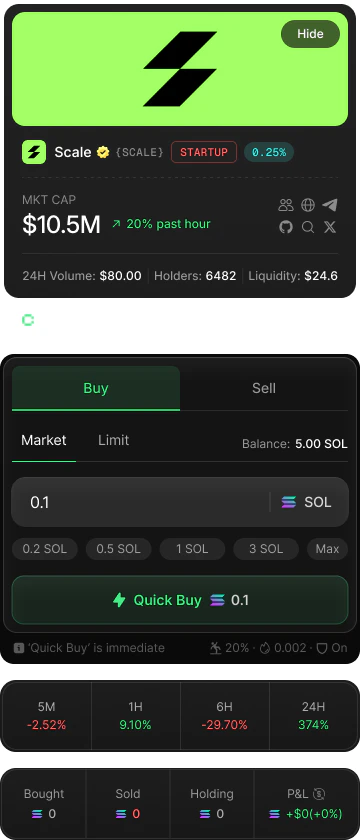
Your personal stats — Bought, Sold, Holding, and P&L
The first grid shows your activity on this specific token. All values are denominated in SOL.If your P&L is positive it is shown in green with a
How P&L is calculated
P&L (profit and loss) answers the question: overall, have I made or lost money on this token?The formula is:+ prefix. If it is negative it is shown in red. The percentage change relative to your total investment is shown alongside the absolute SOL value.Example: You bought 2 SOL worth of tokens. You later sold half for 1.5 SOL. Your remaining holdings are currently worth 1.2 SOL.P&L resets to zero if you sell your entire token balance, because your Holding value becomes 0 and the calculation starts fresh. If you rebuy the same token, P&L begins accumulating again from that point.
Price changes — 5M, 1H, 6H, 24H
Price changes — 5M, 1H, 6H, 24H
The second grid shows how the token’s price has moved over four time windows. Each value is a percentage change relative to the price at the start of that window.
Values are color-coded:
- Green — the price is up over that period.
- Red — the price is down over that period.
- Neutral (dim white) — no change (0%).
Volume stats — 1h Vol, Buys, Sells, Net Vol
Volume stats — 1h Vol, Buys, Sells, Net Vol
The third grid shows market activity for the last hour. All volume figures are in SOL.